Multifaceted Monitoring of Angie, a Fork of the nginx Web Server#
A detailed overview of Angie monitoring capabilities: built-in API for statistics, Console Light for real-time visualization, and Prometheus integration without third-party modules.
A beautiful live demo is better than any pictures: https://console.angie.software/#
Hello, dear reader. My name is Dmitry. I am a systems engineer at Web Server company. Throughout my experience providing technical support services, first at Nginx company, and now at the company developing the Russian web server Angie, we answer a very popular question: "How do I organize monitoring of the web server's state?" Here's how.
Monitoring. "Why bother? Everything's fine in the logs!"
Angie Web Server. "Why? When there's *." How to install. "Is there a build for **?"
API. "I'm telling you, there are logs! Just a sec, let me enable them in prod." What it provides. "What's the difference from logs?" How to configure. "Doesn't it work automatically?" Getting web server configuration. "But there's angie -T."
Console Light – web interface. "Yet another monitoring system?!1?1!!!" What it shows. "What do you mean real-time?" How to install. "Really just a couple of config lines?"
API for Prometheus. "But I'm already using it! Well, yes, we parse logs..." How to configure Angie for integration. "How is this without njs?" Comparison with Console Light. "Do the values really match?"
Conclusion. "So that's what multifaceted means!"
1. Monitoring. "Why bother? Everything's fine in the logs!"#
So, we've outgrown the situation where we react to incidents in the information system's operation based on a call from a user. Now we have full-fledged monitoring systems in our infrastructure, with data collection, an alerting system, and a "fix everything" button.
When answering questions from managers, architects, or information security specialists about how we ensure observability of one of the key components in the process of handling network requests to the infrastructure, we most often list the following. We have system metrics for the web server process (how much CPU or RAM it consumes, how long it's been running), we have data from logs, and less commonly we have the ability to export metrics from the web server using third-party extensions.
Getting system metrics for a process is common practice, the bare minimum for any infrastructure. But sometimes this is extremely insufficient. We see minimal CPU consumption, but the site shows a 502 Bad Gateway error, and everything's terrible.
Getting data from logs is simple. But architects note that essentially, we're retrospectively following requests that have already been processed by that point in time. In the case of a DoS attack, we'll only see in the logs when some requests have already been processed as "failed to handle." But we need to see in the web server monitoring requests that have already arrived but haven't yet been processed by the upstream server. Monitoring should, among other things, show the wind-up for a punch, not show the bruise on the face.
Setting up metric export from your web server using third-party solutions is quite a workable option. The only question is your time to figure out the configuration, build it for your operating system, and accept the risk that tomorrow your web server version might be incompatible with a module that hasn't been updated yet. And remember, information security specialists never sleep.
The built-in features of our product, which we'll discuss further, allow for complete monitoring of Web/Proxy server load in real-time, and also have a number of advanced integration capabilities with the monitoring system in the client's infrastructure.
2. Angie Web Server. "Why? When there's *"#
For those who aren't aware, I'll say, and for others I'll remind, that there's a product called Angie, created as a fork from nginx, developed by Web Server company. The company brings together former lead engineers from NGINX company. It's distributed under the BSD license, it's legal, that's what we were told.
The Angie web server codebase was forked from Nginx 1.23.1. Since then, we've been adding new functionality that doesn't exist in the open-source nginx version. At the same time, we try to port nginx updates to our web server, ensuring the possibility of seamless migration for users from nginx to Angie.
From the very first release, which was in October 2022, Angie includes an API module that implements an HTTP RESTful interface for obtaining basic information about the web server in JSON format, as well as statistics on:
client connections
shared memory zones
DNS queries
HTTP requests
HTTP response cache
stream module sessions
zones of limit_conn http, limit_conn stream, and limit_req modules
The complete list of metrics can be found in the documentation.
Recently, a new version Angie 1.3.0 was released, which implements support for outputting metrics in Prometheus format. We've prepared a web interface for viewing metrics in real-time from a selected instance. And it's time to do a small comparative test of web server monitoring capabilities.
Among Angie's distinctive functionality are:
API support for collecting statistics, configuration, and much more.
Client session binding using sticky session or route method.
2.1. How to install. "Is there a build for **?"#
Detailed instructions on how to install Angie are presented on the official website in Russian and English.
Although we support 11 distributions of various versions on x86-64 and arm64 architectures, in this article I'll only provide the steps necessary to illustrate the web server monitoring capabilities. I'll perform all installations on Debian OS.
Installing Angie is no different from installing any other package from a repository. First, add the key and repository:
sudo apt-get update && \
sudo apt-get install --no-install-recommends --no-install-suggests --yes \
                    ca-certificates curl lsb-release && \
sudo curl -o /etc/apt/trusted.gpg.d/angie-signing.gpg \
                    https://angie.software/keys/angie-signing.gpg && \
echo "deb https://download.angie.software/angie/debian/ `lsb_release -cs` main" \
                    | sudo tee /etc/apt/sources.list.d/angie.list >/dev/null
And install Angie:
sudo apt-get update && \
sudo apt-get install --no-install-recommends --no-install-suggests --yes \
                    angie
Done. The web server is running and the welcome page is available on port 80.
curl -I localhost HTTP/1.1 200 OK Server: Angie/1.3.0 ....
3. API. "I'm telling you, there are logs! Just a sec, let me enable them in prod"#
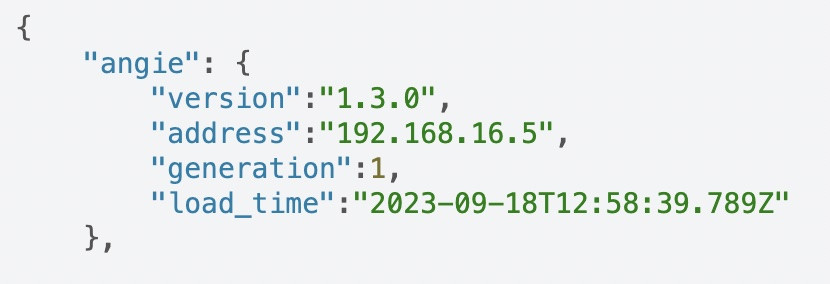
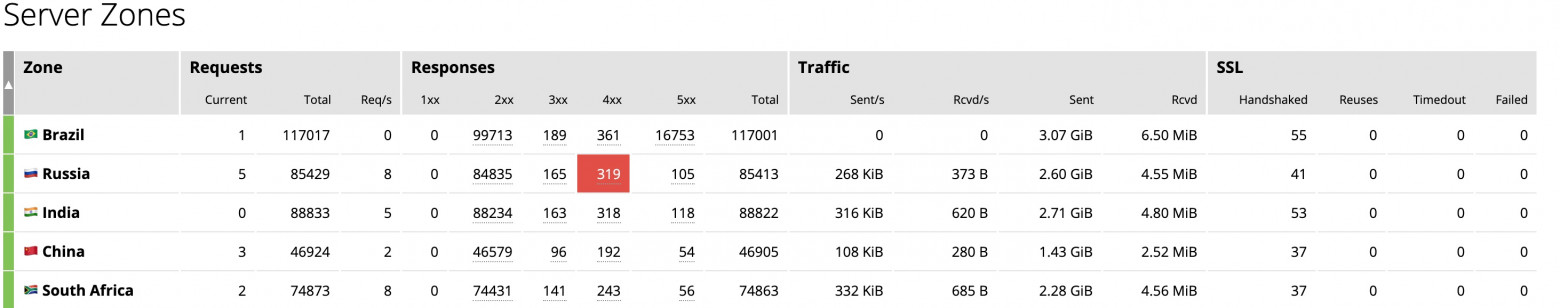
When a client contacts technical support, they're often asked to provide logs for diagnostics. One of the frequently encountered situations is that web server logs in production are disabled. Simply to save resources. The question of parsing logs and sending them to the monitoring system simply doesn't arise. No logs – no problems. But what if we still do log analysis and build a monitoring system based on this data? What's the difference from using metrics through the API? There are several nuances. First, logs are written after the request has been processed. In other words, when the last byte has been sent to the client. What should we do in this case with long-lived connections or slow clients? The API comes to the rescue here. The "processing" metric in "requests" within "server_zones" helps you find out how many requests the server is currently processing. Second, logs cannot tell you anything about either shared memory zones or cache zones used by your server. Yet their overflow due to huge traffic or in various cases of server attacks can lead to disastrous results, segfaults and, consequently, connection drops and even service unavailability. Here the API comes to our rescue again. You can view and calculate zone occupancy and respond to unforeseen situations in time. Third, by getting metrics from runtime through the API, you simply get more accurate values at the moment. And there are simply more of them than you can extract from logs. You can view the complete tree of metrics on the official website. Returning to the question of third-party solutions, the reader may ask, "Why should I change anything? I've been using a comprehensive solution based on the vts module for a long time." Here it's worth noting that solutions like the vts module don't actually provide real-time statistics, since they work in the log phase and counters are calculated only after request processing is complete. In other words, this type of solution has the same disadvantages as log-based monitoring. To enable the API, it's enough to add the "api" directive to the config. Let's comment out the "allow" and "deny" directives in "location /status/" in the configuration file "/etc/angie/http.d/default.conf" so we can immediately see the API page in the browser. (In production, you should still properly configure these directives for security purposes. This also applies to the following parts of this article): Let's add a couple of zones and upstream to the config for clarity: Restart Angie to apply the configuration: and on the /status/ page of your server you will already see JSON with API metrics. Speaking of working with web server configuration. As an additional bonus, the API now has the ability to display your server's configuration. Specifically the one that Angie is currently running on. This can be useful in a number of cases, for example, if for some incredible reason you deleted all configs from the server and want to restore them. Here the output of the "angie -T" command won't help you, since the "angie -T" command performs a syntax check and outputs the configuration from disk. The "angie" binary file will attempt to parse the configuration file specified by default when starting. Now, to understand whether the updated configuration has been applied, you can compare the outputs of the API and "sudo angie -T". Or you can do it even simpler and track the configuration generation. Angie tracks the configuration generation of each of its processes; numbering starts from one when the server starts, and the numbers grow with each configuration reload and are indicated in the process names. After a successful configuration reload (regardless of whether there are changes), the generation numbers for processes that received the new configuration will increase, and if any worker processes from previous generations continue to work, this will be immediately noticeable from the output of the "ps aux | grep angie" command. The API output in the /status/angie/ section will also show the configuration generation. But unlike the ps output, the API output will only show the new config generation.3.1. What it provides. "What's the difference from logs?"#
3.2. How to configure. "Doesn't it work automatically?"#
location /status/ {
  api /status/;
  # allow 127.0.0.1;
  # deny all;
}
upstream foo {
  zone http-upstream-foo 256k;
  server 127.0.0.2 max_conns=10 max_fails=10;
  server 127.0.0.3 max_conns=10 max_fails=10;
  server 127.0.0.4 max_conns=10 max_fails=10;
}

server {
#...
    status_zone example;
#...
    location / {
#...
      status_zone location_zone;
    }
#...
}
sudo angie -t && sudo service angie reload
3.3. Getting web server configuration. "But there's angie -T"#
4. Console Light – web interface. "Yet another monitoring system?!1?1!!!"#
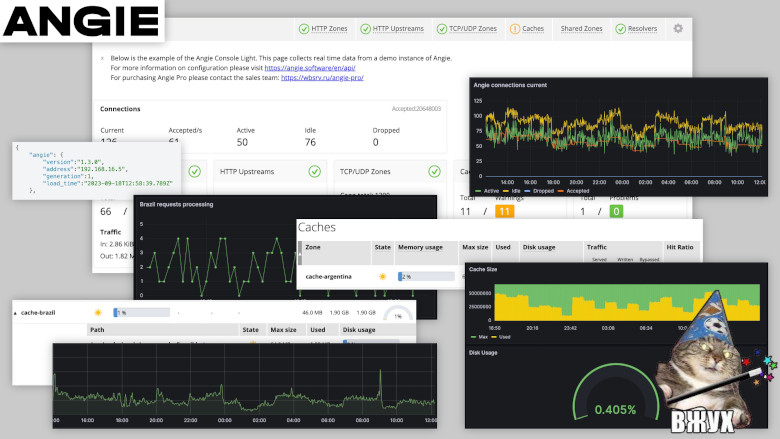
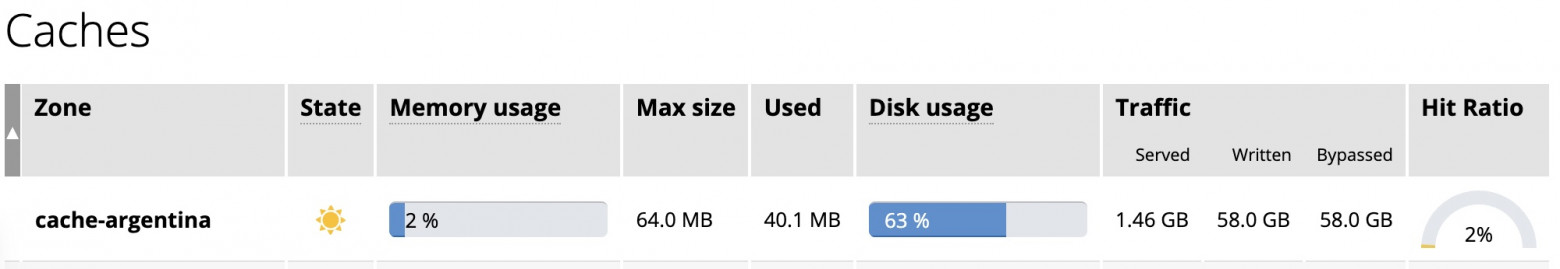
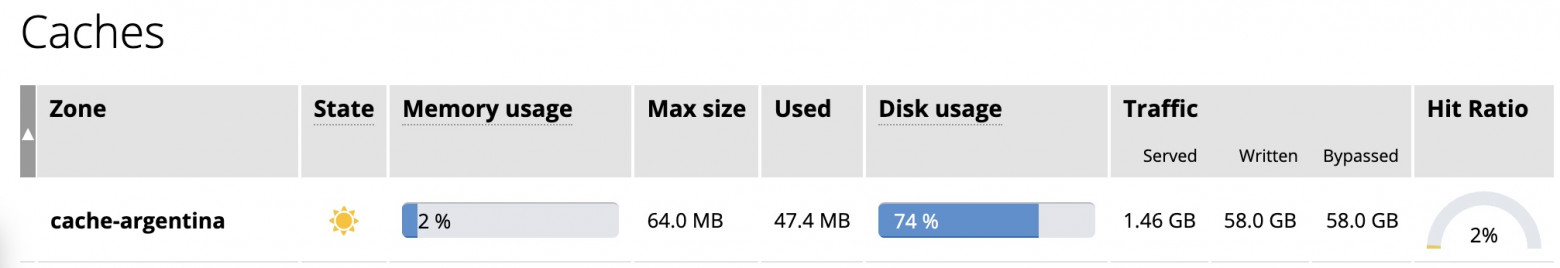
Starting with Angie version 1.3.0, the Console Light feature was added—a lightweight visual console for real-time activity monitoring that displays key server load and performance indicators. And in general, it makes it easier for the admin to track the viability and state of the server. The feature of this simple web page is the display of metrics in real time for a specific web server instance. The page updates with some periodicity (this can be configured). Note that if you have a cluster of several web servers, then each instance in the cluster has its own separate visual console configured. Actually, all the metrics mentioned earlier are grouped here into recommended tabs for tracking. For example, you can find the "processing" metric in "requests" on the HTTP Zones tab. Here it will be called Current. And you can view zone occupancy on the Shared Zones and Caches tabs. You can view our demo version of Console Light at https://console.angie.software/, and a detailed description of the tabs and metrics collected there can be found in the documentation section. This functionality is supplied as a separate package; don't let this fact confuse you, my reader. Console Light is fully integrated with Angie and the API. Let's install the Console Light package to view current server statistics. To do this, simply execute: Then connect Console Light by placing "location /console" in the "server" context of the Angie configuration file ("/etc/angie/http.d/default.conf"). Like this: More detailed information can be found on the official website. Let's restart Angie: And, going to /console, we will see a page with metrics. Here you will immediately see how the Requests and Responses metrics are populated. Since we are configuring our console in the same "server" where the "status_zone" is located, we see how the console itself, by accessing the API, generates statistics for us. I'll note again that in production you shouldn't do such a configuration. It's better to use a separate "server" block used only for monitoring.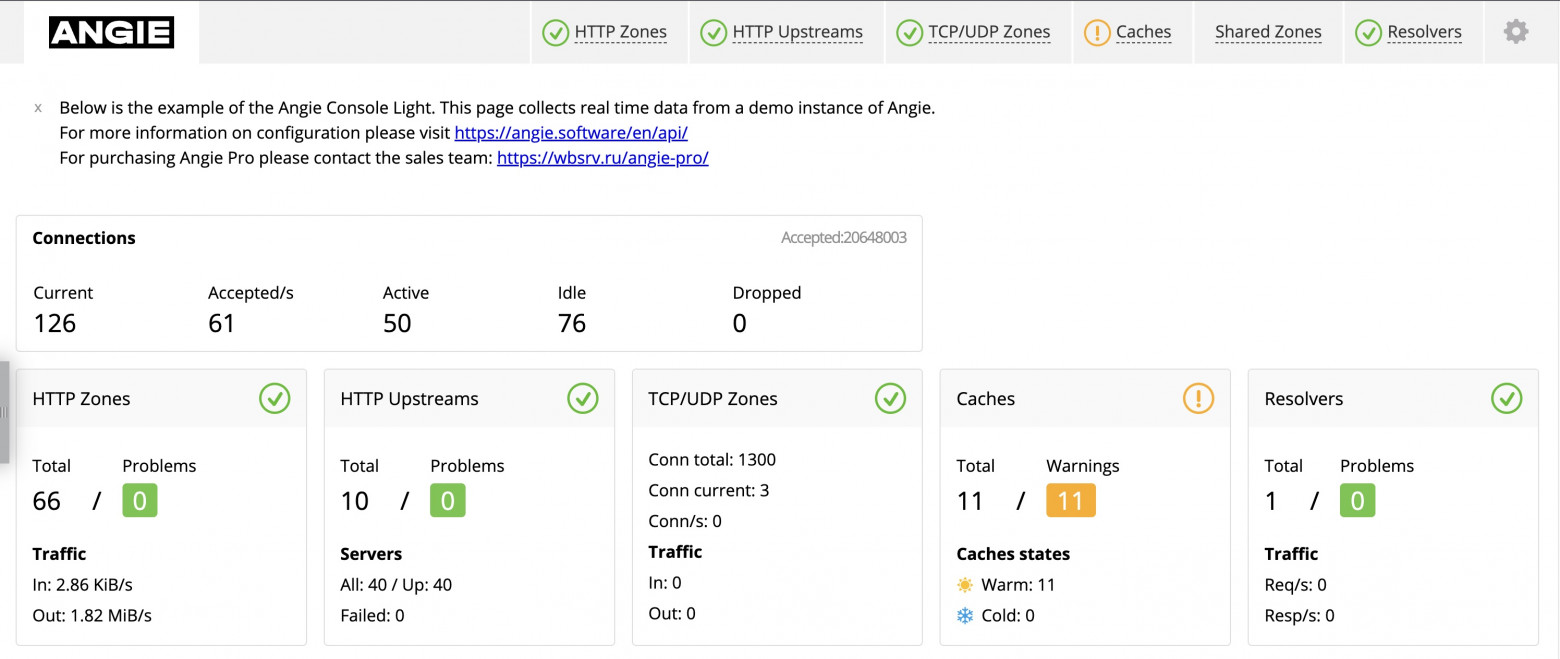
4.1. What it allows you to see. "What does real-time mean?"#
4.2. How to install. "Really just a couple of config lines?"#
sudo apt-get install angie-console-light
location /console {

  alias /usr/share/angie-console-light/html;
  index index.html;

    location /console/api/ {
      api /status/;
  }
}
sudo angie -t && sudo service angie reload
5. API for Prometheus. "But I'm already using it! Well yes, we parse logs..."#
A fairly popular solution for building a monitoring system is to use Prometheus for collecting metrics. We assume that you already have this service installed. Most likely, you populate it through log analysis or use third-party exporters.
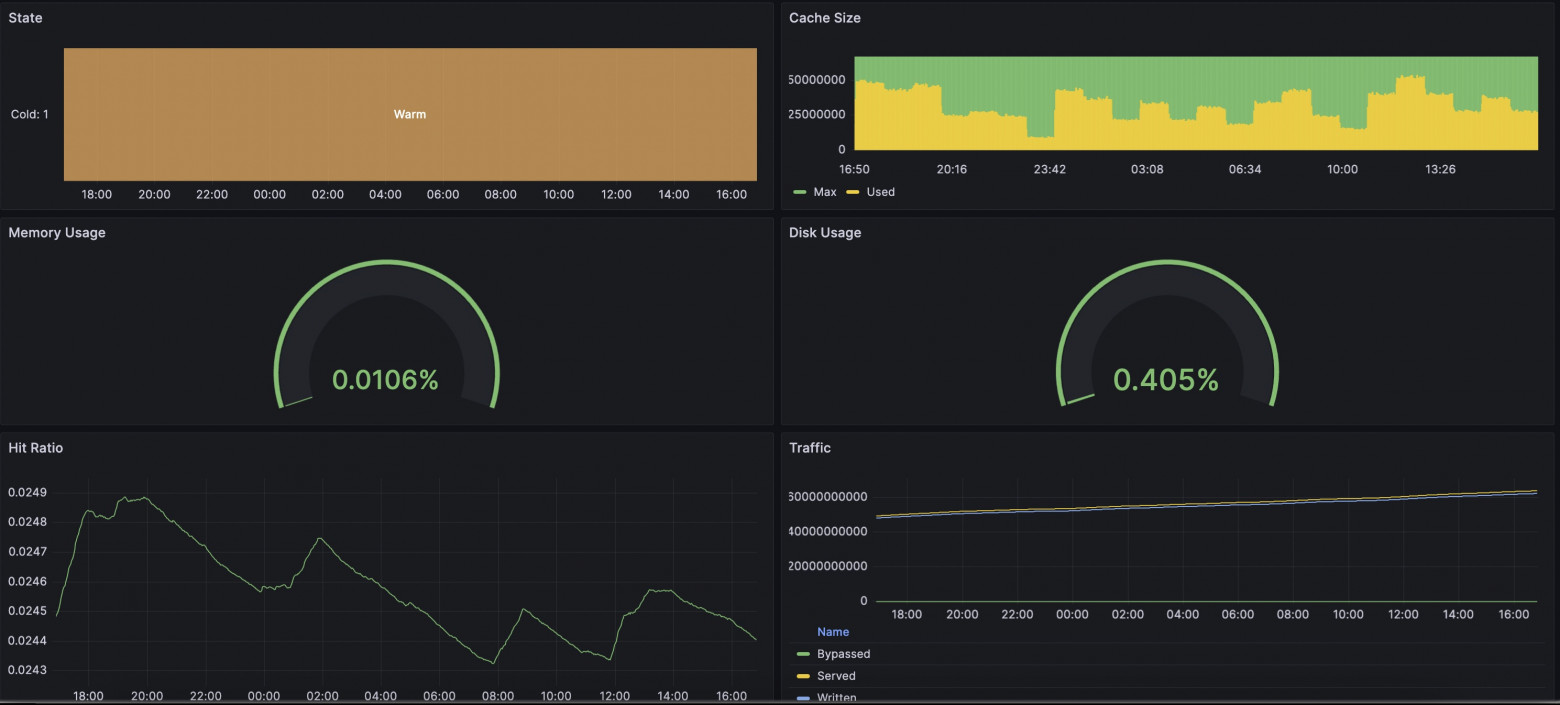
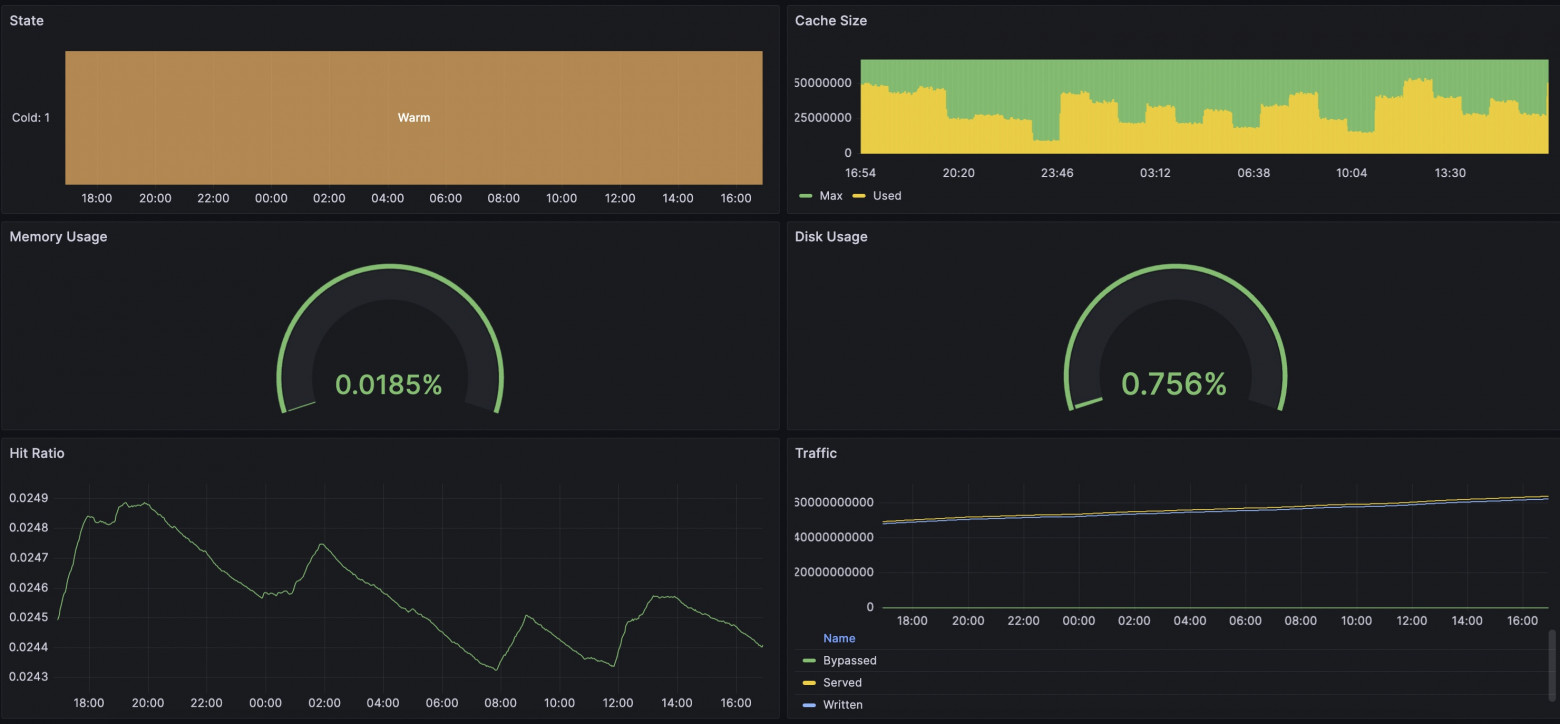
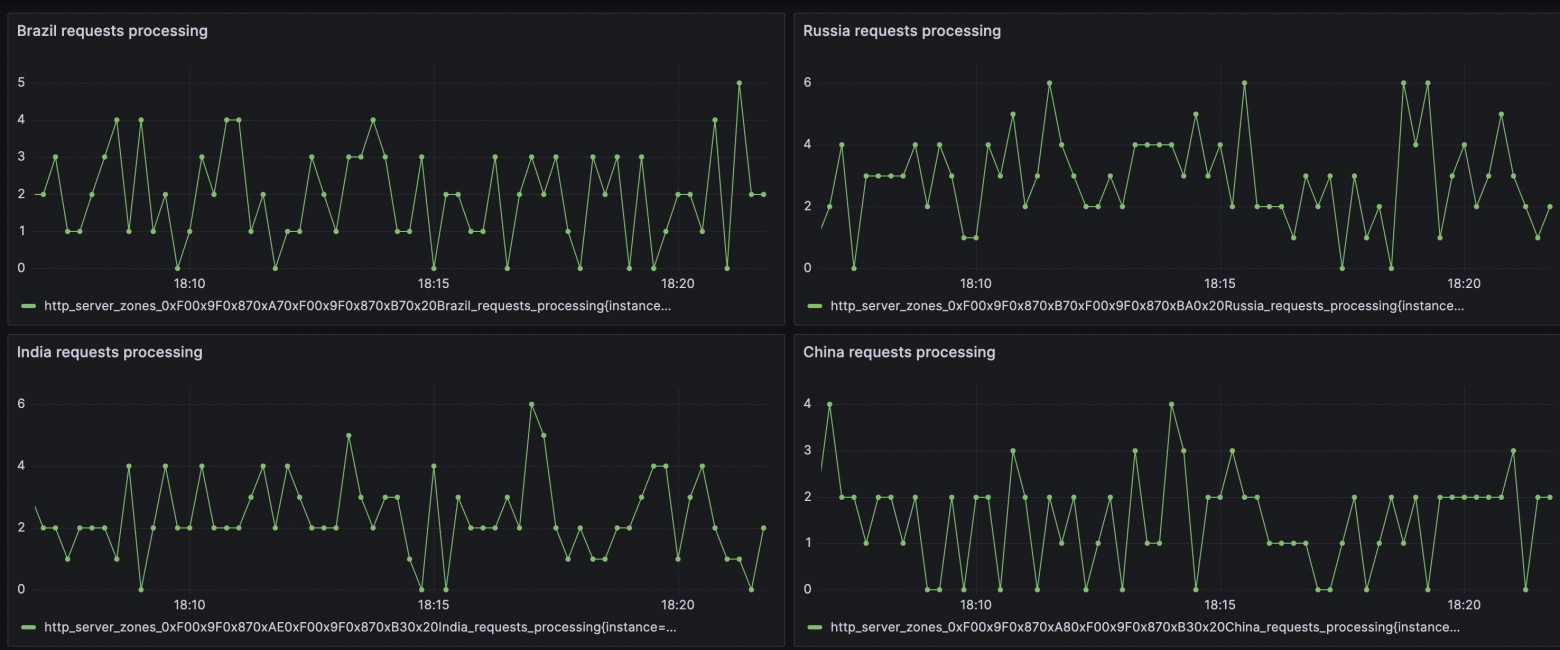
In our case, we made a built-in solution for exporting metrics in Prometheus format. I'll note that we have flexibly configurable templates so you can add your own twist to your metrics collection. The complete list of available metrics is collected in the all template. The new package already includes a template with all available metrics, so it will be enough to simply enable the delivery of these metrics in a convenient location by adding the "prometheus" directive. Restart Angie: And by requesting the /metrics/ address, we will see the familiar Prometheus format. You can find examples online of exporting metrics from nginx using njs. In our case, no js runtime is used; calculation and delivery occur in the web server runtime with minimal overhead. As an engineer, I was interested to see if there was any difference between viewing metrics through Prometheus+Grafana or through Console Light. I set up a simple test environment, configured the web server, integrations with Prometheus and Console Light. I created artificial load on the web server using wrk and scripts. In the screenshots below, you can compare the corresponding metrics. It turned out quite interesting. Overall, the metrics are similar in everything; differences begin when you increase the metric collection interval. If Console Light fetches metrics every second, then in Grafana a 2-minute interval shows metrics with a delay and with some difference. And, as a result, there are differences in the screenshots. At the time when disk usage began to grow alarmingly, Grafana was still showing that everything was fine. Of course, eventually the indicators aligned. The situation with runtime request indicators is also similar. A lot depends on the settings of Grafana and Prometheus themselves; you will need to choose intervals that are suitable for you. But be prepared that with shorter intervals, the services will need to store more data on disk.5.1. How to Configure Angie for Integration. "How Does This Work Without njs?"#
location /metrics/ {
  prometheus all;
}
sudo angie -t && sudo service angie reload
5.2. Comparison with Console Light. "Do the Values Really Match?"#
6. Conclusion. "So That's What Multifaceted Means!"#
It cannot be said that there is a single correct way to organize a web server monitoring system. But we have tried to provide flexibility in the Angie web server for configuring a solution that suits you.
As an engineer, I often encounter situations where users ask for help when everything has already happened and the settings have not yet been configured. Therefore, allow me to take a moment to remind you: it is better to make all necessary settings in advance to be prepared for unforeseen situations. Fortunately, there are detailed instructions for this.
So, about the versatile monitoring approach. The multifaceted nature is expressed in the fact that you can continue to analyze logs, you can use the Angie web server, which provides an API with extended metrics. You can peek at the web server status on a simple web page, Console Light. And finally, you can make a full-fledged integration of web server status information into your metrics collection system based on Prometheus.
Please use it! It was my pleasure to help you!